Staying on top of your account and campaign performance is essential to meeting your advertising goals. Now, with enhancements to inline download and the Overview tab rolling out globally, getting this valuable information just got a whole lot easier.
Save, schedule, and share inline downloaded reports
While you can already download reports from many of the grids on the Account Summary and Campaigns page, you’ll now have the ability to simultaneously save, schedule, and share them, all in one place. After you click the Download button placed above the grids, you’ll see new Download report options that’ll allow you to save, schedule and share the scheduled reports with other users via email. You can also view and download the scheduled and saved custom reports from grids in both your Campaigns page and Account Summary page, using Saved Campaign Reports and Saved Account Reports.
Let’s say you need to look at the performance of five of your important campaigns every Monday and make adjustments to maximize conversions. Instead of remembering to go to Bing Ads online every Monday, filtering on the five campaigns, setting the desired time range, selecting the right metrics, and downloading the data every week, you can simply schedule the report. And every Monday, when the report is ready you will receive an email and all you need to do is click on the link to download the report.
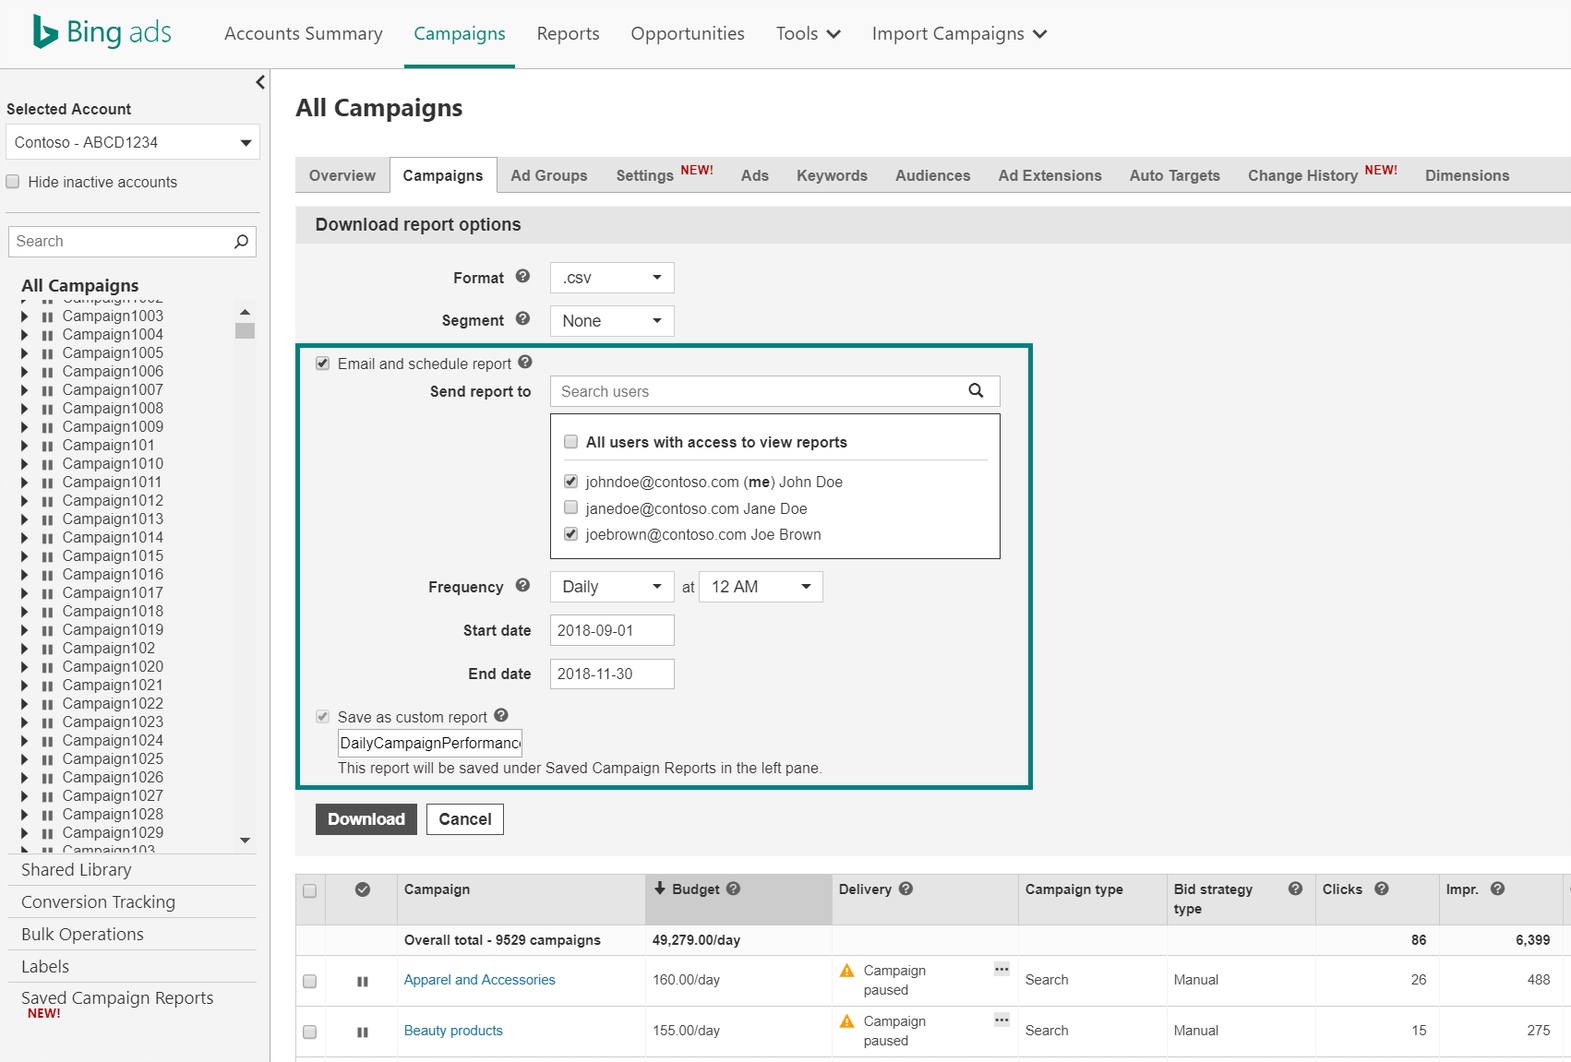 Screenshot of new inline download options
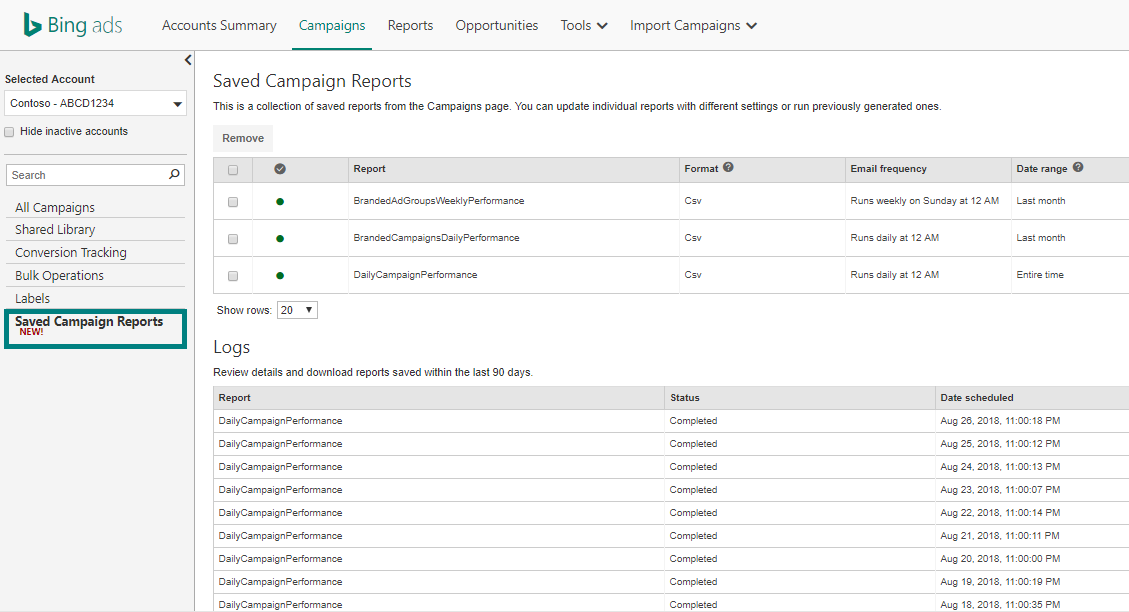
Screenshot of Saved Campaign Reports
Overview Tab
The Overview tab lets you quickly scan visuals that tell you how your campaigns are doing. Through customizable tiles and a dashboard experience, the Overview tab makes it easy to find out what works and what doesn’t so that you can optimize your campaigns to meet your goals. We have introduced several new tiles as well as made updates to existing ones.
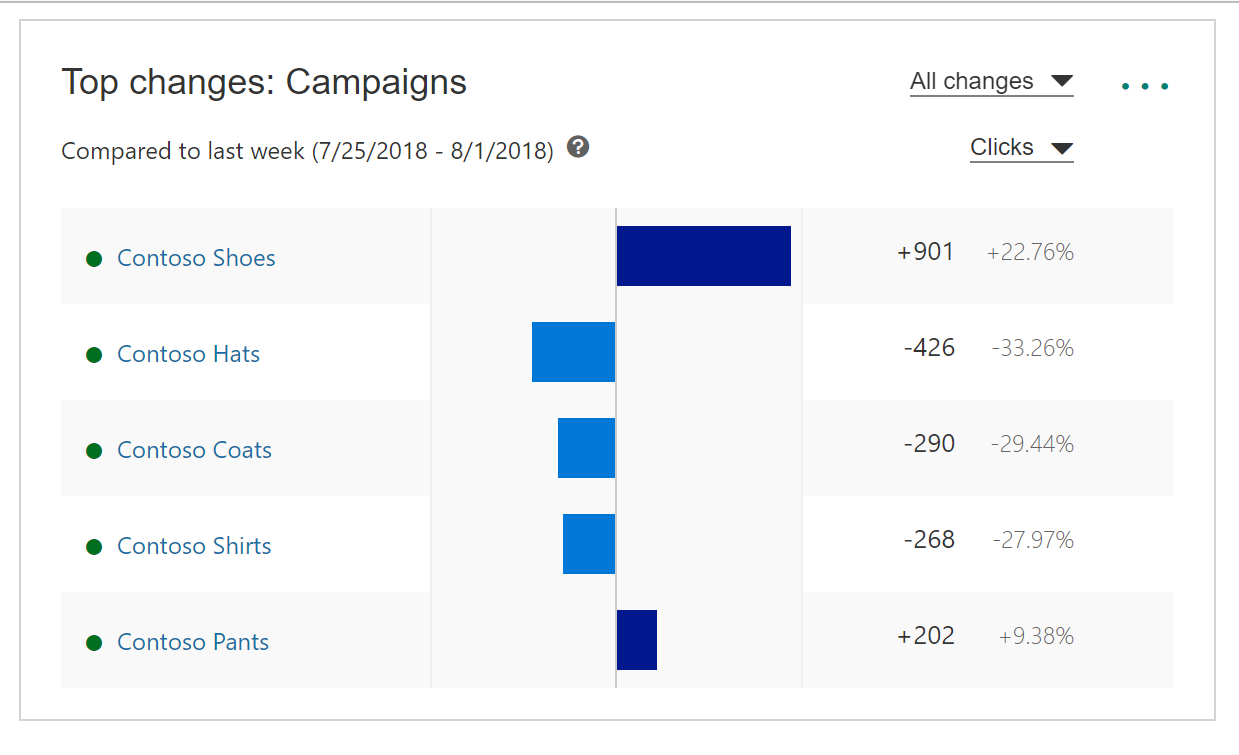
The Top Changes tile identifies the campaigns and ad groups responsible for the biggest increases and decreases to your performance metrics during a specified period. You can choose to see your top gainers, top decliners, or combination of both.
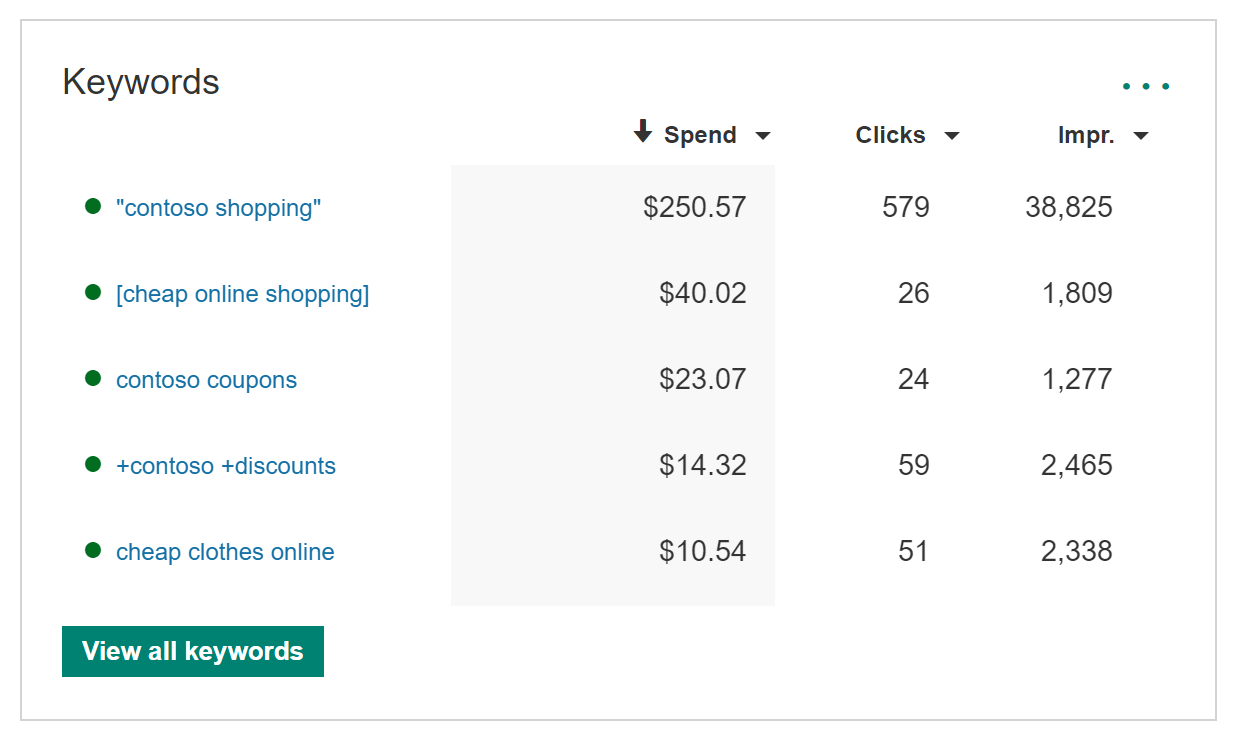
With the Keywords tile, you will be able to monitor performance of your top keywords across your campaigns for a selected metric.
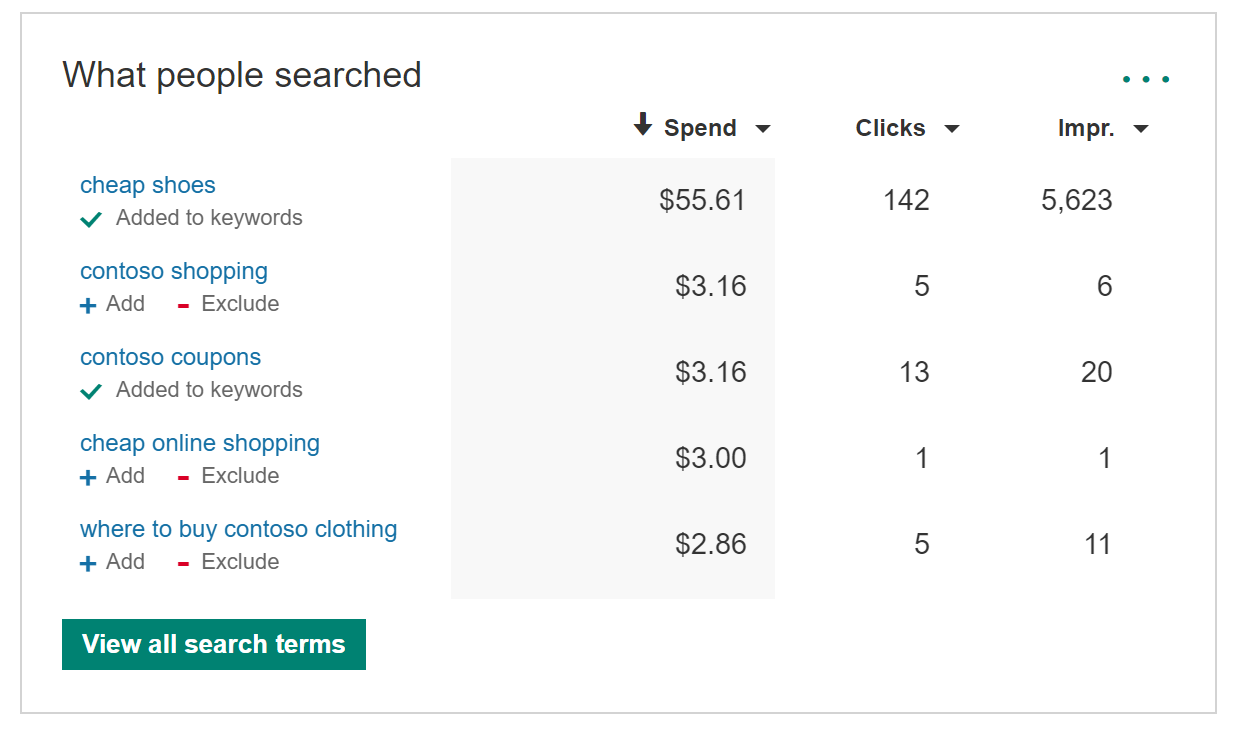
You can use the “What people searched” tile to get a glance into the queries potential customers are searching for to trigger your ads. Based on this data you can decide if you’d like to add these search terms as keywords or negative keywords, which can be done right from the tile!
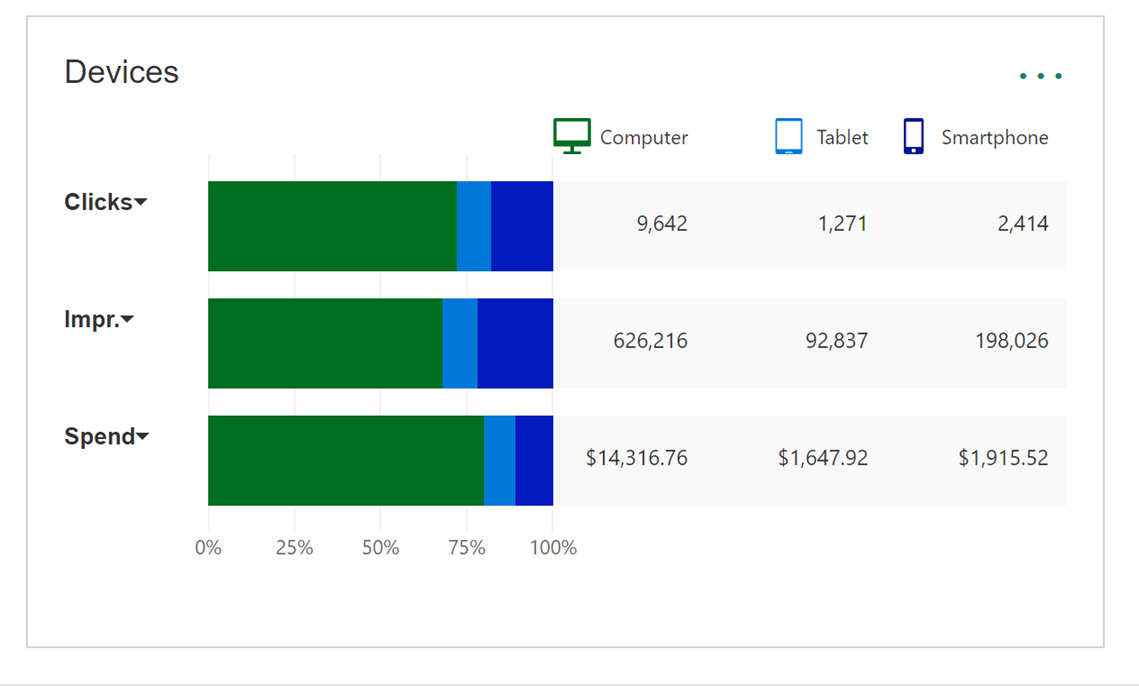
In addition, we’ve updated the visualization of the Devices tile making it easier to compare your performance across computer, tablet, and smartphone as well as added support for period over period comparison.
The Overview tab is a great place to start your day because it is filled with visualizations and insights that tell you a story of how your campaigns are performing. It will be the first page you land on in Bing Ads, allowing you to answer the question
“How am I doing?” before deep diving into your account. Overtime, we will continue to add more visualizations to the Overview tab with the continued goal of giving you strong insight and scope into your campaign performance.
Questions or comments?
If you have any feedback or questions, feel free to contact us via
Twitter, visit the
Bing Ads Feature Suggestion Forum, or send your feedback directly to
BingAds-feedback@microsoft.com.